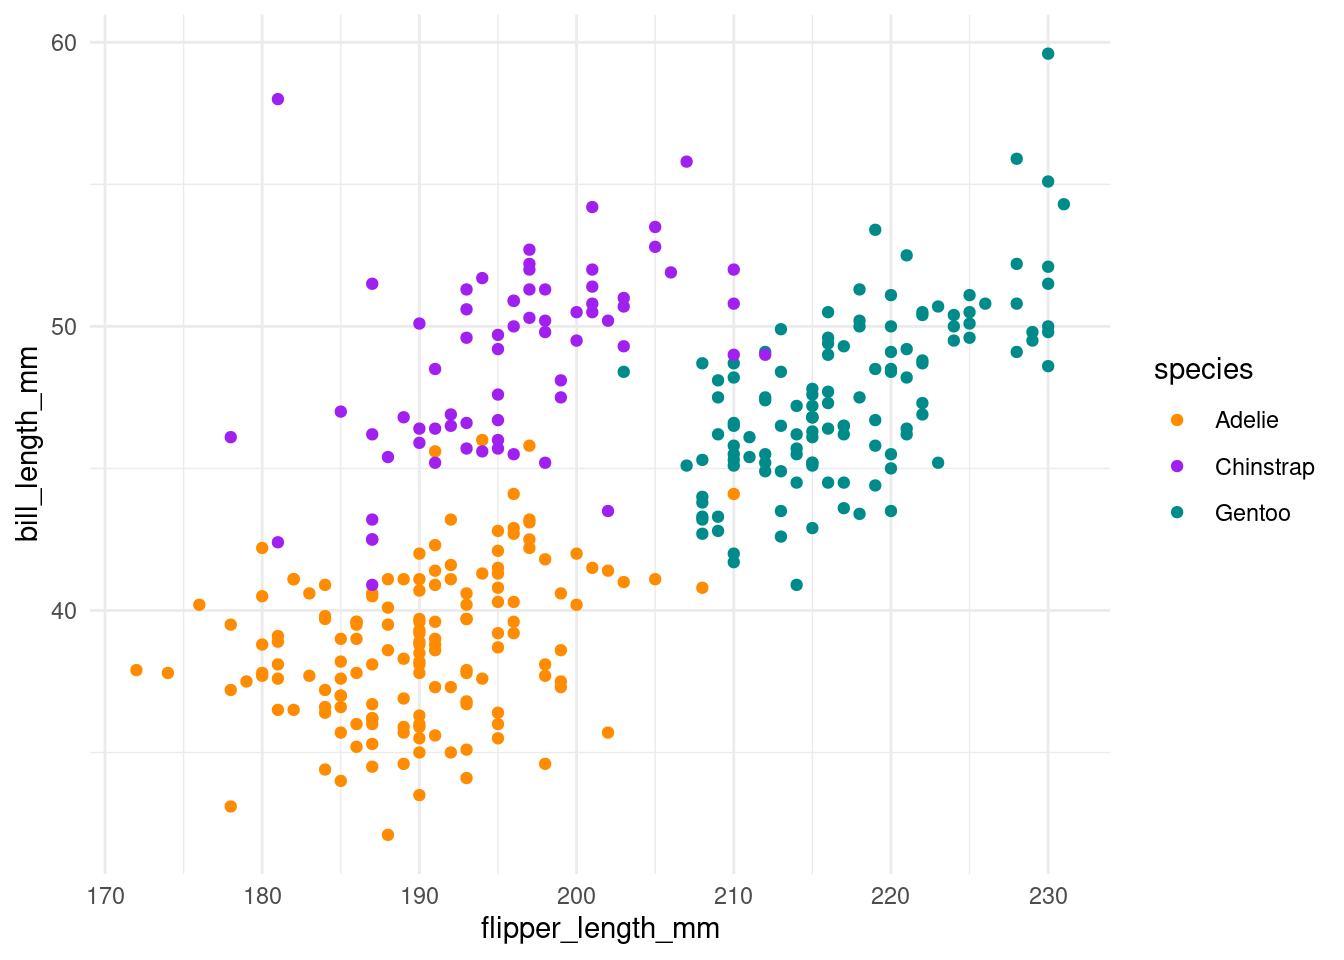
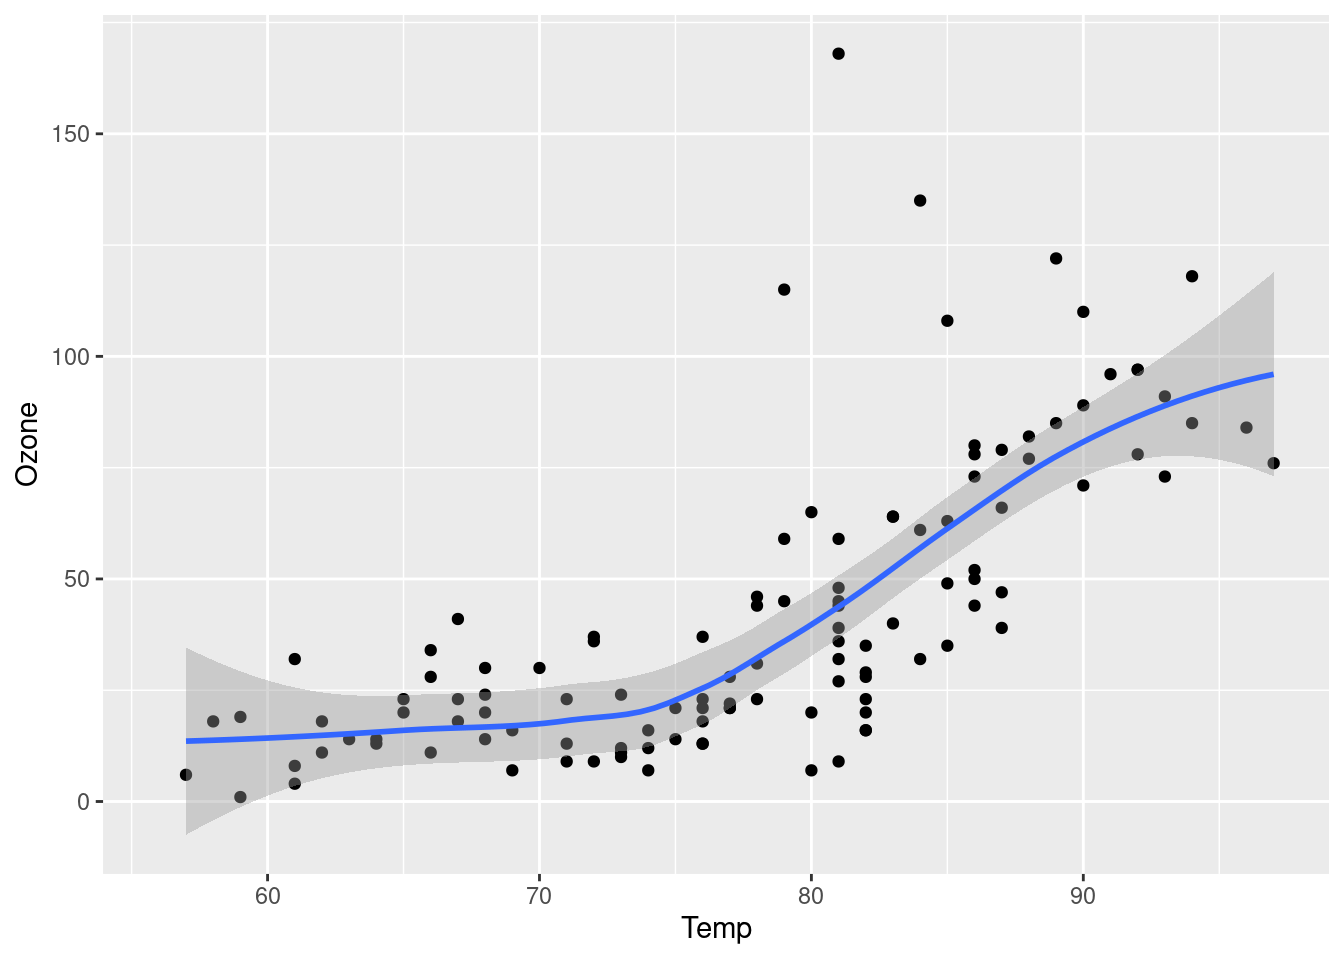
# 画图The `penguins` data contains size measurements for penguins from three islands in the Palmer Archipelago, Antarctica.The three species of penguins have quite distinct distributions of physical dimensions (@fig-penguins).```{r}#| label: fig-penguins#| fig-cap: "Dimensions of penguins across three species."#| warning: falselibrary(tidyverse, quietly =TRUE)library(palmerpenguins)penguins |>ggplot(aes(x = flipper_length_mm, y = bill_length_mm)) +geom_point(aes(color = species)) +scale_color_manual(values =c("darkorange", "purple", "cyan4")) +theme_minimal()```这是另外一个例子(@fig-airquality):```{r}#| label: fig-airquality#| fig-cap: "Temperature and ozone level."#| warning: falselibrary(ggplot2)ggplot(airquality, aes(Temp, Ozone)) +geom_point() +geom_smooth(method ="loess")```