
tidypptsda cleans and analyses visit records from automatic pig feeding stations (NEDAP and FIRE): body weight cleaning, average daily gain (ADG), feed intake correction (ADFI) and feed conversion ratio (FCR).
- Feeder errors are flagged with the 16 criteria of Casey et al. (2005).
- Daily feed intake is corrected with the linear mixed model of Jiao et al. (2014).
- Body weights are tracked back from the reliable end of the test, then checked by robust quadratic regression and LOESS.
- Missing daily weights and feed intakes of the stage are filled (linear interpolation or LOESS inside, growth curve or regression on body weight at the ends); ADG is the slope of the daily weights, FCR = ADFI / ADG.
- ADG and ADFI are computed over the same body weight stage, and every pig gets a confidence flag that explains how its values were obtained.
- Nothing is removed silently: each step returns a
removedtable with the reason. - Few dependencies: cli, data.table, ggplot2, and MASS / nlme which ship with R.
Cheatsheet: English, 中文. Documentation (in Chinese): 快速入门; all articles by topic (data, methods, results, validation) are in the article index. To plan pig entries into the testing stations (all-in/all-out, back-scheduled or weekly-batch rolling groups), use the planner.
Installation
# install.packages("pak")
pak::pak("tony2015116/tidypptsda")
Version 0.1.0 (the earlier API) stays available:
pak::pak("tony2015116/tidypptsda@v0.1.0")Example
library(tidypptsda)

res <- run_pipeline(nedap, verbose = 0)
res

head(res$fcr$per_pig[, .(responder, adg, adfi, fcr, fcr_flag)])
#>    responder      adg     adfi      fcr       fcr_flag
#> 1:     13913 1209.897 2642.654 2.184196             ok
#> 2:     13918 1162.966 2566.372 2.206747             ok
#> 3:     13954 1124.224 2681.418 2.385127 low_confidence
#> 4:     13996 1334.979 2860.245 2.142538             ok
#> 5:     14962 1278.746 2830.550 2.213536             ok
#> 6:     15006 1317.472 3121.544 2.369343             ok
Step by step, with any QC setting:
qc      <- qc_config(stage_range = c(30, 120))
visits  <- prep_visits(fire, qc = qc)          # or read_station("export/")
weight  <- clean_weight(visits, qc)
adg     <- calc_adg(weight)
adfi    <- calc_adfi(visits, adg)
fcr     <- calc_fcr(adg, adfi)

plot_adg(adg, weight = weight) |> save_plots("plots", suffix = "growth")
write_report(run_pipeline(fire), "report")   # HTML report, a page per station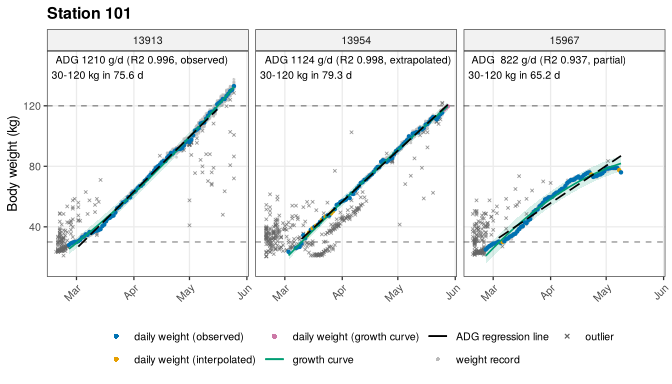
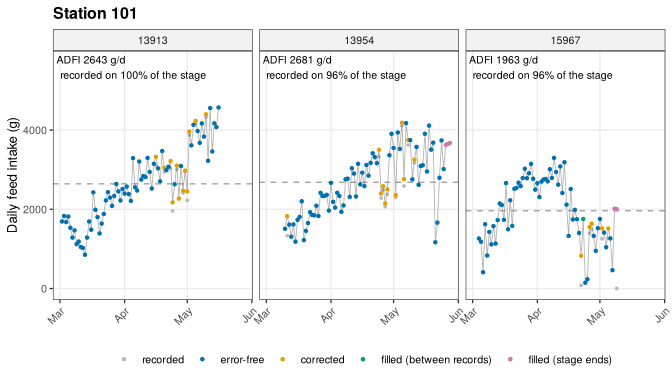
Daily feed intake over the stage: recorded, error-free, corrected and filled days, with the ADFI as a dashed line:
References
Casey, D. S., Stern, H. S., & Dekkers, J. C. M. (2005). Identification of errors and factors associated with errors in data from electronic swine feeders. Journal of Animal Science, 83, 969-982.
Jiao, S., Maltecca, C., Gray, K. A., & Cassady, J. P. (2014). Feed intake, average daily gain, feed efficiency, and real-time ultrasound traits in Duroc pigs: I. Journal of Animal Science, 92, 2377-2386.
