Example datasets
Two example datasets ship with the package, one per station type. They are raw station exports, before any processing.
Internal helpers
Small internal tools shared by every function of the package:
-
verbosity: every exported function has
verbose = 0/1/2(silent / summary / details). Messages go throughppt_msg(). -
input checks:
as_dt()always returns a copy, so user objects are never modified;check_cols()reports missing columns. -
per-pig fitting:
fit_by_pig()runs a function on each pig. A pig that fails is recorded and skipped instead of stopping everything. -
removal log:
new_removed()builds theremovedtable returned by every analysis step. -
result object:
new_ppt_result()gives everycalc_*()function the same return structure.
qc_config
All quality-control thresholds live in one object created by
qc_config(). Any single parameter can be overridden.
# Default settings
qc <- qc_config()
qc$duration_max
#> [1] 3600

# Override single parameters
qc_config(stage_range = c(40, 110), weight_outlier = c("rlm", "loess", "sd"))
#>
#> ── QC settings ──
#>
#> Station transfer
#>   misread_max_visits: 2
#>   max_gap_days: 3
#>   max_jump_kg: 10
#> Body weight records
#>   weight_range: 15, 150
#>   adapt_days: 7
#>   weight_track: TRUE
#>   track_tol: 0.08
#>   weight_outlier: rlm , loess, sd
#>   outlier_combine: any
#>   rlm_cutoff: 0.5
#>   sd_max: 3
#>   loess_span: 0.75
#> Pig-level checks
#>   min_records: 20
#>   min_test_days: 35
#>   max_missing_rate: 0.3
#>   entry_weight_max: 65
#>   exit_weight_min: 85
#>   track_flag_share: 0.4
#>   smooth_r2_min: 0.99
#> Growth and ADG
#>   stage_range: 40, 110
#>   curve_model: poly2
#>   max_extrap_days: 30
#>   curve_extrap: start
#> Feeder errors
#>   fiv_range: -20, 2000
#>   fiv0_abs_max: 20
#>   duration_max: 3600
#>   speed_fiv_lo_max: 500
#>   speed_strict_max: 110
#>   speed_range: 2, 170
#>   idle_duration_max: 500
#>   trough_diff_range: -20, 1800
#>   max_unidentified_feed_kg: 90
#>   fiv_max_by_weight: NULL (off)
#> Daily feed intake
#>   dfi_range: 0, 6
#>   dfi_quantile: NULL (off)
#>   dfi_correct: lmm
#>   impute_method: loess_pop
#>   long_gap_days: 3
#> Confidence flags
#>   max_edge_extrap_days: 15
#>   min_coverage: 0.7
#>   bin_width: 10
#>   min_bin_coverage_kg: 6
#>   bin_fcr_limits: NULL (off)
read_station
read_station() reads one or many station export files
(or a whole folder) and returns one standard table: the
same column names, types and units for NEDAP and FIRE, ready for
[prep_visits()].
Which column of the export holds which field is described by a
station format. The package has a built-in format for
each station type, so the usual exports need no setup. For an export
with other column names or positions (another software version, Chinese
headers, another device), write the format once as a small tab-separated
file and pass it with format.
station_format("fire", file = "fire_format.txt") writes the
built-in format as a template to start from.
# Write the example data to two CSV files, then read them back
folder <- file.path(tempdir(), "fire_export")
dir.create(folder, showWarnings = FALSE)
data.table::fwrite(fire[fire$Location == 101, ], file.path(folder, "fire_101.csv"))
data.table::fwrite(fire[fire$Location == 102, ], file.path(folder, "fire_102.csv"))

raw <- read_station(folder)
#>
#> ── Reading 2 files ─────────────────────────────────────────────────────────────
#> ℹ Detected station type "fire"
#> ✔ Read 9794 rows from 2 files (FIRE)
head(raw)
#>    responder location          entry_time           exit_time duration
#>       <char>   <char>              <POSc>              <POSc>    <num>
#> 1:     35877      101 2023-12-19 14:15:39 2023-12-19 14:18:02       NA
#> 2:     35873      101 2023-12-19 14:18:03 2023-12-19 14:23:05       NA
#> 3:     35878      101 2023-12-19 14:23:15 2023-12-19 14:28:45       NA
#> 4:     35855      101 2023-12-19 14:29:05 2023-12-19 14:34:29       NA
#> 5:     35877      101 2023-12-19 14:34:30 2023-12-19 14:34:37       NA
#> 6:     35853      101 2023-12-19 14:34:38 2023-12-19 14:36:26       NA
#>    feed_intake weight trough_in trough_out topup  source_file
#>          <num>  <num>     <num>      <num> <num>       <char>
#> 1:          46   67.6       678        632   286 fire_101.csv
#> 2:         248   60.8       632        384     0 fire_101.csv
#> 3:         201   70.8       670        469   286 fire_101.csv
#> 4:         121   51.2       755        634   286 fire_101.csv
#> 5:           0    0.0       634        634     0 fire_101.csv
#> 6:           0   88.6       634        634     0 fire_101.csv
attr(raw, "station")
#> [1] "fire"

# The built-in format, written as a template for other exports
station_format("fire", file = file.path(folder, "fire_format.txt"))
#> ✔ Station format written to /tmp/RtmpUJqsUI/fire_export/fire_format.txt

unlink(folder, recursive = TRUE)
station_format
A station format says which column of an export holds which standard
field, and in which unit. station_format() shows the
built-in format of a station type and writes it as a template file for
other exports.
station_format("nedap")
#>          field      column   unit required              description
#>         <char>      <char> <char>   <lgcl>                   <char>
#> 1:   responder   responder      -     TRUE       Transponder number
#> 2:    location    location      -     TRUE      Station (feeder) ID
#> 3:  entry_time  visit_time      -     TRUE            Entrance time
#> 4:   exit_time           -      -    FALSE                Exit time
#> 5:    duration    duration      s    FALSE          Occupation time
#> 6: feed_intake feed_intake      g     TRUE Feed intake of the visit
#> 7:      weight      weight   auto     TRUE              Body weight
#> 8:       breed       breed      -    FALSE                    Breed
station_format("fire")
#>           field       column   unit required                     description
#>          <char>       <char> <char>   <lgcl>                          <char>
#>  1:   responder          Tag      -     TRUE              Transponder number
#>  2:    location     Location      -     TRUE             Station (feeder) ID
#>  3:  entry_time   Date,Entry      -     TRUE                   Entrance time
#>  4:   exit_time    Date,Exit      -     TRUE                       Exit time
#>  5: feed_intake     Consumed     kg     TRUE        Feed intake of the visit
#>  6:      weight       Weight     kg     TRUE                     Body weight
#>  7:   trough_in       Ent Wt     kg     TRUE       Trough weight at entrance
#>  8:  trough_out       Ext Wt     kg     TRUE           Trough weight at exit
#>  9:       topup Topup Amount     kg    FALSE Feed dispensed during the visit
#> 10:       breed        breed      -    FALSE                           Breed

# Write a template, edit it, and use it
f <- tempfile(fileext = ".txt")
station_format("fire", file = f)
#> ✔ Station format written to /tmp/RtmpUJqsUI/file1f1e28accd4b.txt
cat(readLines(f), sep = "\n")
#> # tidypptsda station format: FIRE
#> # One line per field, separated by tabs: field, column, unit.
#> # column: column name or position; alternatives with |; date,time joined with ,; - if absent.
#> # unit: kg / g / auto for masses, s / min for duration, - or a strptime format for times.
#> # Required fields: responder, location, entry_time, exit_time, feed_intake, weight, trough_in, trough_out.
#> field    column  unit
#> responder    Tag -
#> location Location    -
#> entry_time   Date,Entry  -
#> exit_time    Date,Exit   -
#> feed_intake  Consumed    kg
#> weight   Weight  kg
#> trough_in    Ent Wt  kg
#> trough_out   Ext Wt  kg
#> topup    Topup Amount    kg
#> breed    breed   -
unlink(f)
prep_visits
prep_visits() turns the output of
read_station() (or a raw NEDAP or FIRE export already in R,
such as the example datasets) into one standard visit table that every
later step uses:
- one row per visit, including unidentified visits
(no transponder read), marked with
identified = FALSE. They are needed to compute the differences between subsequent visits on a feeder (Casey et al. 2005); - the same column names and units for both stations: body weight in kg, feed intake and trough weights in g, times as POSIXct (UTC);
- FIRE visits that cross midnight get the right exit time;
- a body weight of 0 becomes
NA; - pigs seen at more than one station are kept (see Station transfer).
visits <- prep_visits(fire)
#>
#> ── Preparing FIRE visits ───────────────────────────────────────────────────────
#>   Visits read                                9,794
#>   └ unidentified (kept, identified = FALSE)     51    0.5%
#>   └ crossing midnight (exit time corrected)     68    0.7%
#>   └ body weight 0 (set to NA)                  478    4.9%
#> ℹ No pig was seen at more than one station
#> ✔ 26 pigs at 2 stations, 9,794 visits over 66 days 0.1s
#> ℹ No breed column. To use breed in the feed intake model and breed-specific limits, add it with `add_breed()`.
head(visits)
#>    responder responder_raw identified location       date seq_days seq_in_day
#>       <char>        <char>     <lgcl>   <char>     <Date>    <int>      <int>
#> 1:     35877         35877       TRUE      101 2023-12-19        1          1
#> 2:     35873         35873       TRUE      101 2023-12-19        1          1
#> 3:     35878         35878       TRUE      101 2023-12-19        1          1
#> 4:     35855         35855       TRUE      101 2023-12-19        1          1
#> 5:     35877         35877       TRUE      101 2023-12-19        1          2
#> 6:     35853         35853       TRUE      101 2023-12-19        1          1
#>    seq_in_location          entry_time           exit_time duration feed_intake
#>              <int>              <POSc>              <POSc>    <num>       <num>
#> 1:               1 2023-12-19 14:15:39 2023-12-19 14:18:02      143          46
#> 2:               2 2023-12-19 14:18:03 2023-12-19 14:23:05      302         248
#> 3:               3 2023-12-19 14:23:15 2023-12-19 14:28:45      330         201
#> 4:               4 2023-12-19 14:29:05 2023-12-19 14:34:29      324         121
#> 5:               5 2023-12-19 14:34:30 2023-12-19 14:34:37        7           0
#> 6:               6 2023-12-19 14:34:38 2023-12-19 14:36:26      108           0
#>    weight trough_in trough_out topup
#>     <num>     <num>      <num> <num>
#> 1:   67.6       678        632   286
#> 2:   60.8       632        384     0
#> 3:   70.8       670        469   286
#> 4:   51.2       755        634   286
#> 5:     NA       634        634     0
#> 6:   88.6       634        634     0

# Unidentified visits are kept for the feeder error checks
table(visits$identified)
#>
#> FALSE  TRUE
#>    51  9743

# Station history of each pig
head(attr(visits, "stations"))
#>    responder location_path main_location n_locations n_transfers transfer
#>       <char>        <char>        <char>       <int>       <int>   <lgcl>
#> 1:     25822           101           101           1           0    FALSE
#> 2:     35853           101           101           1           0    FALSE
#> 3:     35855           101           101           1           0    FALSE
#> 4:     35862           101           101           1           0    FALSE
#> 5:     35865           101           101           1           0    FALSE
#> 6:     35869           101           101           1           0    FALSE
#>    misreads longest_gap_days weight_jump_kg
#>       <int>            <num>          <num>
#> 1:        0        0.7254051             NA
#> 2:        0        0.6270370             NA
#> 3:        0        0.6021412             NA
#> 4:        0        0.5934722             NA
#> 5:        0        0.5991898             NA
#> 6:        0        0.6719097             NA

# NEDAP data gets the same columns and units
nedap_visits <- prep_visits(nedap, verbose = 0)
summary(nedap_visits$weight)
#>    Min. 1st Qu.  Median    Mean 3rd Qu.    Max.     NAs
#>   20.50   43.00   80.00   77.17  106.50  147.75     391
add_breed
Pig breed (or line) usually is not in the station export and cannot
be read from the transponder number. add_breed() merges a
breed table from your own records into the visit table. With a
breed column:
-
calc_adfi()adds breed as a fixed effect to the correction model; -
fiv_max_by_weightlimits can differ by breed; -
calc_fcr()summarises traits by breed.
visits <- prep_visits(nedap, verbose = 0)
# a breed table from your own herd records, one row per pig
pigs <- unique(visits[identified == TRUE, responder])
breeds <- data.frame(responder = pigs, breed = rep(c("YY", "LL"), length.out = length(pigs)))
visits <- add_breed(visits, breeds)
#> ✔ Breed added for 30 of 30 pigs: LL (15), YY (15)
table(unique(visits[identified == TRUE, .(responder, breed)])$breed)
#>
#> LL YY
#> 15 15
clean_weight
clean_weight() cleans the body weight records of
identified visits in three layers:
-
record rules: weights outside
weight_rangeand weights of the adaptation period (adapt_days) are flagged; -
outlier detection per pig: the weight is first
tracked back from the end of the test (
weight_track); then one or more methods fit a curve to the remaining records of each pig and flag records far from it:-
"rlm"(default): quadratic robust regression with bisquare weights (MASS::rlm), records with weight belowrlm_cutoffare outliers; -
"loess"(default): robust LOESS (family = "symmetric"), residuals beyondsd_maxrobust SDs; -
"stl": STL decomposition of the daily median weight (weekly period, robust), residuals beyondsd_maxrobust SDs. Falls back to LOESS for pigs with fewer than 14 days; -
"sd": quadratic least squares, residuals beyondsd_maxSDs;
-
-
pig checks: number of valid records, test length,
missing rate, entry and exit weight, share removed by the tracking and
the R
of the LOESS smooth.
Nothing is deleted silently: every record keeps a
qc_flag, and every removed pig is listed in
removed with the reason.
visits <- prep_visits(nedap, verbose = 0)
w <- clean_weight(visits)
#>
#> ── Cleaning body weight (track + rlm + loess) ──────────────────────────────────
#>   Weight records                       31,472
#>   └ adaptation after entry (not used)   3,404   10.8%
#>   └ outliers                            5,667   18.0%
#>     └ by tracking                       1,543    4.9%
#> ! Pigs: 28 kept, 1 low confidence, 1 removed 0.7s
w
#>
#> ── <ppt_weight> ──
#>
#> Pigs: 30 (keep 28, low confidence 1, removed 1)
#> $per_pig: 30 rows x 17 columns
#> $daily: 2789 rows x 7 columns
#> $removed: 1 row x 4 columns
#> $records: 31472 rows x 10 columns

# Why pigs were removed
w$removed
#>    responder location         step               reason
#>       <char>   <char>       <char>               <char>
#> 1:     15964      101 clean_weight 0 valid weights < 20

# Records flagged as outliers
head(w$records[outlier == TRUE])
#>    responder location       date seq_days          entry_time weight fitted
#>       <char>   <char>     <Date>    <int>              <POSc>  <num>  <num>
#> 1:     13913      101 2024-02-19        1 2024-02-19 22:21:41   23.5     NA
#> 2:     13913      101 2024-02-20        2 2024-02-20 01:00:02   23.5     NA
#> 3:     13913      101 2024-02-20        2 2024-02-20 01:05:04   31.0     NA
#> 4:     13913      101 2024-02-20        2 2024-02-20 02:53:50   23.5     NA
#> 5:     13913      101 2024-02-20        2 2024-02-20 04:27:26   24.0     NA
#> 6:     13913      101 2024-02-20        2 2024-02-20 06:52:21   28.5     NA
#>    rlm_w outlier    qc_flag
#>    <num>  <lgcl>     <char>
#> 1:    NA    TRUE adaptation
#> 2:    NA    TRUE adaptation
#> 3:    NA    TRUE adaptation
#> 4:    NA    TRUE adaptation
#> 5:    NA    TRUE adaptation
#> 6:    NA    TRUE adaptation

# Other outlier methods
w_sd <- clean_weight(visits, qc = qc_config(weight_outlier = c("rlm", "sd")), verbose = 0)
table(w_sd$per_pig$status)
#>
#>           keep low_confidence        removed
#>             28              1              1
calc_adg
calc_adg() estimates average daily gain (ADG) over the
body weight stage stage_range (default 30-120 kg):
- a growth curve is fitted to the valid weight records of each pig
(
curve_model:"poly2"by default,"poly1","poly3"or"gompertz"; Gompertz falls back to a quadratic curve when it does not converge); - the stage end is the first time the curve reaches the upper stage
weight; the stage start is the last time the curve
rises through the lower stage weight before that. A curve that dips back
below 30 kg (for example after noisy early records) therefore starts the
stage only once the pig has really entered it. The search runs up to
max_extrap_daysbefore the first and after the last record. Before the first record the curve is continued by a straight tangent line with the slope of the first 14 days of records, after the last record by the curve itself (curve_extrap = "start", default);"tangent"uses the line at both ends,"curve"the curve at both ends; - every day of the stage gets a body weight: the daily median of the
valid records (
"observed"); a day without valid weight between two recorded days is filled by linear interpolation ("interpolated"); a day before the first or after the last recorded day is filled by the growth curve ("curve"); - ADG = slope of the linear regression of these daily weights on the day, over the stage days. Its R² tells how straight the growth was.
Every pig gets an adg_type:
-
"observed": both stage limits are reached inside the recorded period; -
"extrapolated": at least one limit needs extrapolation, but no more thanmax_extrap_days; -
"partial": a limit is not reached even after extrapolation. ADG is then computed over the part of the stage that is covered; -
"none": less than 7 days of the stage are covered; ADG isNA.
visits <- prep_visits(nedap, verbose = 0)
w <- clean_weight(visits, verbose = 0)
adg <- calc_adg(w)
#>
#> ── ADG over 30-120 kg (poly2 curve) ────────────────────────────────────────────
#>   Pigs                                   29
#>   └ observed (stage inside the records)  21   72.4%
#>   └ extrapolated at the ends              7   24.1%
#>   └ partial (stage not fully reached)     1    3.4%
#> ! 1 pig does not reach the whole stage: ADG is based on part of it (adg_type = "partial").
#> ✔ ADG 1205 ± 133 g/d (mean ± SD) 0.3s
head(adg$per_pig[, .(responder, adg_type, start_date, end_date, stage_days, adg)])
#>    responder     adg_type start_date   end_date stage_days      adg
#>       <char>       <char>     <Date>     <Date>      <num>    <num>
#> 1:     13913     observed 2024-03-02 2024-05-16   75.56102 1209.897
#> 2:     13918     observed 2024-03-06 2024-05-24   78.43858 1162.966
#> 3:     13954 extrapolated 2024-03-10 2024-05-28   79.28093 1124.224
#> 4:     13996     observed 2024-02-28 2024-05-07   69.15285 1334.979
#> 5:     14962     observed 2024-02-26 2024-05-07   70.15055 1278.746
#> 6:     15006     observed 2024-02-28 2024-05-07   68.69428 1317.472

# Gompertz curve, with quadratic fallback
adg_g <- calc_adg(w, qc = qc_config(curve_model = "gompertz"), verbose = 0)
table(adg_g$per_pig$curve_used)
#>
#> gompertz + tangent (start)
#>                         29

# Source of the daily weights over the stage
table(adg$daily[in_stage == TRUE, source])
#>
#>        curve interpolated     observed
#>           37           12         2158
flag_feed_errors
flag_feed_errors() applies the 16 error criteria of
Casey et al. (2005, Table 3) to every visit.
The seven variables are computed on the complete visit sequence of each feeder, including unidentified visits, sorted by entrance time:
- FIV = feed intake per visit (g), OTV = occupation time (s), FRV = FIV / (OTV / 60) (g/min, not computed when OTV <= 0);
- LWD = trough weight at entrance of the following visit - at exit of this visit; FWD = trough weight at entrance of this visit - at exit of the preceding visit (FIRE only, NEDAP has no trough weights);
- LTD = entrance time of the following visit - exit time of this visit; FTD = entrance time of this visit - exit time of the preceding visit.
| # | Error | Visits considered | Threshold (default) |
|---|---|---|---|
| 1 | FIV-lo | all | FIV < -20 g |
| 2 | FIV-hi | all | FIV > 2000 g |
| 3 | FIV-0 | OTV = 0 | |FIV| > 20 g |
| 4 | OTV-lo | all | OTV < 0 s |
| 5 | OTV-hi | all | OTV > 3600 s |
| 6 | FRV-hi-FIV-lo | 0 < FIV < 50 g | FRV > 500 g/min |
| 7 | FRV-hi-strict | FIV >= 50 g, preceding or following visit FIV < -20 g | FRV > 110 g/min |
| 8 | FRV-hi | FIV >= 50 g, neither neighbour FIV < -20 g | FRV > 170 g/min |
| 9 | FRV-0 | FRV = 0 | OTV > 500 s |
| 10 | FRV-lo | FRV != 0 | |FRV| <= 2 g/min |
| 11-12 | LWD-lo / LWD-hi | all but the last visit on the feeder | LWD < -20 g / > 1800 g |
| 13-14 | FWD-lo / FWD-hi | all but the first visit on the feeder | FWD < -20 g / > 1800 g |
| 15 | LTD-lo | all but the last visit | LTD < 0 s |
| 16 | FTD-lo | all but the first visit | FTD < 0 s |
The thresholds come from [qc_config()]. Feed disappearance in
unidentified visits (-20 g <= FIV <= 2000 g) is summed per feeder;
Casey et al. discarded pens above 90 kg, here a warning is given above
max_unidentified_feed_kg.
visits <- prep_visits(fire, verbose = 0)
flagged <- flag_feed_errors(visits, verbose = 2)
#>
#> ── Flagging feeder errors (Casey et al. 2005) ──────────────────────────────────
#> ✔ 2.62% of 9,743 identified visits with at least one error 0.0s
#> • FRV-lo: 64 (0.66%)
#> • LWD-hi: 60 (0.62%)
#> • FWD-hi: 60 (0.62%)
#> • FIV-lo: 33 (0.34%)
#> • FRV-hi: 28 (0.29%)
#> • FIV-hi: 21 (0.22%)
#> • LWD-lo: 5 (0.05%)
#> • FRV-hi-strict: 4 (0.04%)
#> • FWD-lo: 4 (0.04%)
#> • FRV-0: 1 (0.01%)
attr(flagged, "feeders")
#>    location n_visits n_unidentified unidentified_feed_kg error_rate
#>      <char>    <int>          <int>                <num>      <num>
#> 1:      101     6014             30                2.148 0.01788102
#> 2:      102     3780             21                0.621 0.03937217
calc_adfi
calc_adfi() estimates average daily feed intake (ADFI)
over the same body weight stage as [calc_adg()], so that FCR compares
like with like.
Correction (Jiao et al. 2014, after Casey et
al. 2005): for each pig and day, the error-free intake y
(sum of FIV over visits without error) is modelled with a linear mixed
model fitted on all pig-days:
y ~ location + breed + BW + ADG + 16 x PTE + 11 x OTD + 4 x FID + (1 | pig)
- PTE: share of the day’s visits with error type p; OTD: occupation time of visits with error p (types 1, 2, 6-14); FID: feed intake of visits with error p (types 4, 5, 15, 16);
- BW: body weight of the day from [calc_adg()] (observed, interpolated
or from the growth curve, column
weight_filled); ADG of the pig; -
locationis a fixed effect when there is more than one station, andbreedwhen the data have abreedcolumn (see [add_breed()]) with more than one breed.
The corrected intake is y - sum(b x error covariates):
only the effects of the error covariates are removed, so a day without
errors keeps its recorded intake. Covariates without variation or
perfectly collinear with others are dropped before fitting. Days on
which every visit has an error have no error-free intake and are
imputed.
Checks and imputation over the stage days of each pig:
- corrected intake below 0, outside
dfi_range, or outside the optionaldfi_quantilelimits is set to missing; - a gap of up to
long_gap_days(3) days between recorded days is filled from a robust LOESS smooth of the daily intake over the days; -
impute_method = "loess_pop"(default): a longer gap, and the days before the first recorded day, are filled from the population curve of daily intake on body weight, scaled to the pig:dfi = r * f(bw).fis a quadratic regression of daily intake on body weight over the recorded stage days of all pigs (of each breed with at least 10 pigs when there is abreedcolumn; other pigs use the curve of all pigs), held constant beyond the weights it was fitted on.ris the pig’s intake level, its recorded intake divided byfover its recorded stage days, shrunk towards 1 with weightn / (n + 10)fornrecorded days. A single pig rarely covers the whole stage, so its own regression on weight is often flat or steep where it has data and goes wrong far from it (a late entry gets the intake of 60 kg at 30 kg); the population curve gives the shape, the pig its level. The days after the last recorded day are filled by the pig’s own linear regression of daily intake on body weight: a pig that leaves early has recorded its late trend itself, while the population curve flattens at high weights and underestimated its late intake (by 43-129 g/d when 20-30 days were missing at the end, in a leakage-free check on 457 pigs); -
impute_method = "loess_lm": the longer gaps and the ends by a per-pig linear regression of daily intake on body weight (the method before version 1.3.0); -
impute_method = "linear": linear interpolation between recorded days (whatever the gap length), the per-pig regression on body weight at the ends.
Use [validate_truncation()] to compare the methods on your own data:
it removes all visits of some pigs over some days and reruns the whole
pipeline, so nothing of the hidden days leaks into the result
([validate_adfi()] is faster and looks at the imputation step alone). In
such a check on 457 NEDAP pigs, with 20 days missing at the start, the
ADFI error was 7.5% with "loess_lm" and 4.9% with
"loess_pop" and curve_extrap = "start"; at the
end, "loess_pop" keeps the unbiased per-pig regression.
Precision still depends mainly on how many days are missing at the stage
ends, which is why such pigs are flagged by [calc_fcr()].
Day states: "org" (no error, recorded value),
"corr" (corrected), "iii" (filled between
recorded days), "elrp" (filled before the first or after
the last recorded day), "missing".
visits <- prep_visits(nedap, verbose = 0)
w <- clean_weight(visits, verbose = 0)
adg <- calc_adg(w, verbose = 0)
adfi <- calc_adfi(visits, adg)
#>
#> ── Flagging feeder errors (Casey et al. 2005) ──────────────────────────────────
#> ✔ 1.58% of 31,652 identified visits with at least one error 0.0s
#>
#> ── ADFI over 30-120 kg ─────────────────────────────────────────────────────────
#> ℹ Correction model: 2575 pig-days, 10 error covariates
#> ℹ Population curve of intake on body weight: all (29 pigs)
#>   Stage pig-days                     2,207
#>   └ recorded without error (org)     1,905   86.3%
#>   └ corrected (corr)                   270   12.2%
#>   └ filled between records (iii)         1   <0.1%
#>   └ filled at the stage ends (elrp)     31    1.4%
#>   └ outside dfi_range                    1   <0.1%
#> ✔ ADFI 2845 ± 360 g/d (mean ± SD) 0.2s
head(adfi$per_pig)
#>    responder location  stage     adfi     adg_type adfi_raw adfi_error_free
#>       <char>   <char> <char>    <num>       <char>    <num>           <num>
#> 1:     13913      101 30-120 2642.654     observed 2624.829        2623.974
#> 2:     13918      101 30-120 2566.372     observed 2540.500        2539.662
#> 3:     13954      101 30-120 2681.418 extrapolated 2622.948        2622.221
#> 4:     13996      101 30-120 2860.245     observed 2839.957        2836.714
#> 5:     14962      101 30-120 2830.550     observed 2816.375        2816.083
#> 6:     15006      101 30-120 3121.544     observed 3107.429        3107.229
#>    n_stage_days n_observed n_corrected n_interpolated n_extrapolated n_missing
#>           <int>      <int>       <int>          <int>          <int>     <int>
#> 1:           76         76          12              0              0         0
#> 2:           80         80          15              0              0         0
#> 3:           80         77          11              0              3         0
#> 4:           70         70           7              0              0         0
#> 5:           72         72           8              0              0         0
#> 6:           70         70           7              0              0         0
#>    n_extrap_start n_extrap_end coverage
#>             <int>        <int>    <num>
#> 1:              0            0   1.0000
#> 2:              0            0   1.0000
#> 3:              0            3   0.9625
#> 4:              0            0   1.0000
#> 5:              0            0   1.0000
#> 6:              0            0   1.0000
table(adfi$daily[in_stage == TRUE, state])
#>
#> corr elrp  iii  org
#>  270   31    1 1905
head(adfi$model)
#>           term      estimate    std_error      p_value
#>         <char>         <num>        <num>        <num>
#> 1: (Intercept)  -1034.723262  306.8930401 7.585135e-04
#> 2: location102     -2.797787   63.2856637 9.650757e-01
#> 3:          bw     23.338374    0.3577956 0.000000e+00
#> 4:         adg      1.725667    0.2444888 1.703038e-07
#> 5:  pte_fiv_hi -11834.326758 5882.7526284 4.435732e-02
#> 6:  pte_otv_hi  -1931.619656 3368.2285196 5.663690e-01
calc_fcr
calc_fcr() combines ADG and ADFI, both computed over the
same body weight stage, into the feed conversion ratio FCR = ADFI / ADG
(kg feed per kg gain) and its inverse, feed efficiency G:F = ADG /
ADFI.
Each pig gets fcr_flag = "ok" or
"low_confidence", with the reasons in
fcr_note: the growth curve or the feed intake extrapolated
over more than max_edge_extrap_days (default 15) at the
start or end of the stage, an inner 10 kg class with recorded weights
spanning less than min_bin_coverage_kg (default 6 kg), a
segment FCR outside the optional bin_fcr_limits, ADG on
part of the stage only, less than min_coverage (default
0.7) of the stage with recorded feed intake, or weight data flagged by
[clean_weight()].
visits <- prep_visits(nedap, verbose = 0)
adg <- calc_adg(clean_weight(visits, verbose = 0), verbose = 0)
adfi <- calc_adfi(visits, adg, verbose = 0)
fcr <- calc_fcr(adg, adfi)
#>
#> ── FCR over 30-120 kg ──────────────────────────────────────────────────────────
#>   Pigs with FCR     29
#>   └ ok              23   79.3%
#>   └ low confidence   6   20.7%
#> ✔ FCR 2.36 ± 0.14 (mean ± SD) 0.0s
head(fcr$per_pig[, .(responder, adg, adfi, fcr, fcr_flag, fcr_note)])
#>    responder      adg     adfi      fcr       fcr_flag
#>       <char>    <num>    <num>    <num>         <char>
#> 1:     13913 1209.897 2642.654 2.184196             ok
#> 2:     13918 1162.966 2566.372 2.206747             ok
#> 3:     13954 1124.224 2681.418 2.385127 low_confidence
#> 4:     13996 1334.979 2860.245 2.142538             ok
#> 5:     14962 1278.746 2830.550 2.213536             ok
#> 6:     15006 1317.472 3121.544 2.369343             ok
#>                                   fcr_note
#>                                     <char>
#> 1:
#> 2:
#> 3: weight records cover 5.0 kg of 80-90 kg
#> 4:
#> 5:
#> 6:
fcr$summary[group == "all"]
#>     group        trait     n          min          max       median
#>    <char>       <char> <int>        <num>        <num>        <num>
#> 1:    all          adg    29  821.6537633 1404.1822971 1230.4801777
#> 2:    all         adfi    29 1962.8256429 3540.2716430 2812.5426352
#> 3:    all          fcr    29    2.1425384    2.7773018    2.3685027
#> 4:    all           gf    29    0.3600617    0.4667361    0.4222077
#> 5:    all   stage_days    29   65.0686763   96.0346641   73.5551659
#> 6:    all start_weight    29   29.9999925   30.0000105   30.0000000
#> 7:    all   end_weight    29   81.7066712  120.0000038  119.9999997
#>            mean           sd           cv
#>           <num>        <num>        <num>
#> 1: 1205.2355800 1.325465e+02 1.099756e-01
#> 2: 2844.9425395 3.600194e+02 1.265472e-01
#> 3:    2.3608004 1.423354e-01 6.029118e-02
#> 4:    0.4250185 2.470859e-02 5.813534e-02
#> 5:   75.0289278 7.602231e+00 1.013240e-01
#> 6:   29.9999998 3.541864e-06 1.180622e-07
#> 7:  118.6795398 7.110893e+00 5.991675e-02
plot_adg, plot_adfi and save_plots
One plot per station, one panel per pig. Axes adapt to the data and
to stage_range, so no point is dropped. Colours come from a
colour-blind safe palette (Okabe-Ito) without extra packages.
visits <- prep_visits(nedap, verbose = 0)
w <- clean_weight(visits, verbose = 0)
adg <- calc_adg(w, verbose = 0)
adfi <- calc_adfi(visits, adg, verbose = 0)

g <- plot_adg(adg, weight = w, locations = "101", responders = c("13913", "13918", "13954"))
#> ✔ Created 1 growth plot
g$plot[[1]]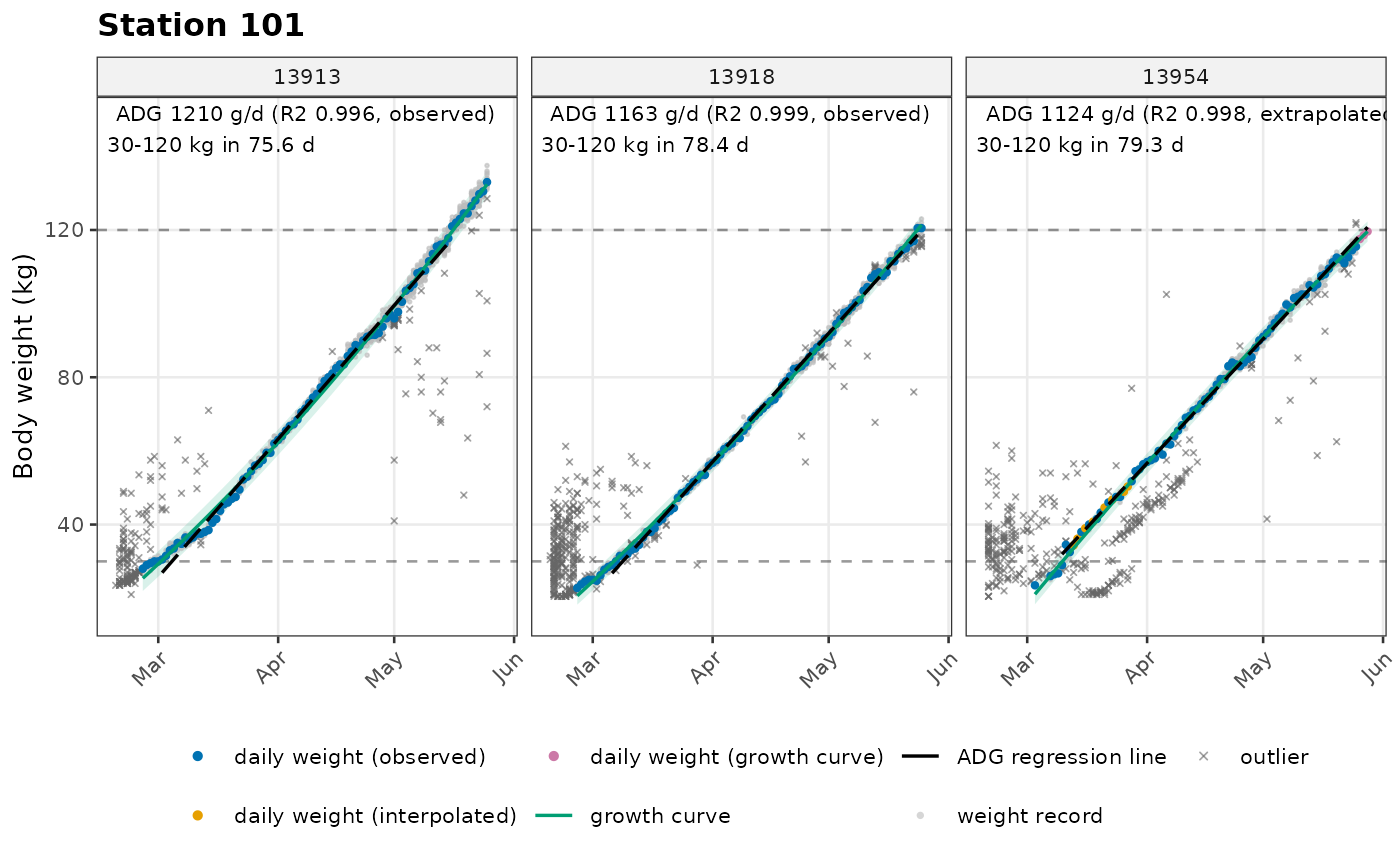
f <- plot_adfi(adfi, responders = c("13913", "13918", "13954"))
#> ✔ Created 1 feed intake plot
f$plot[[1]]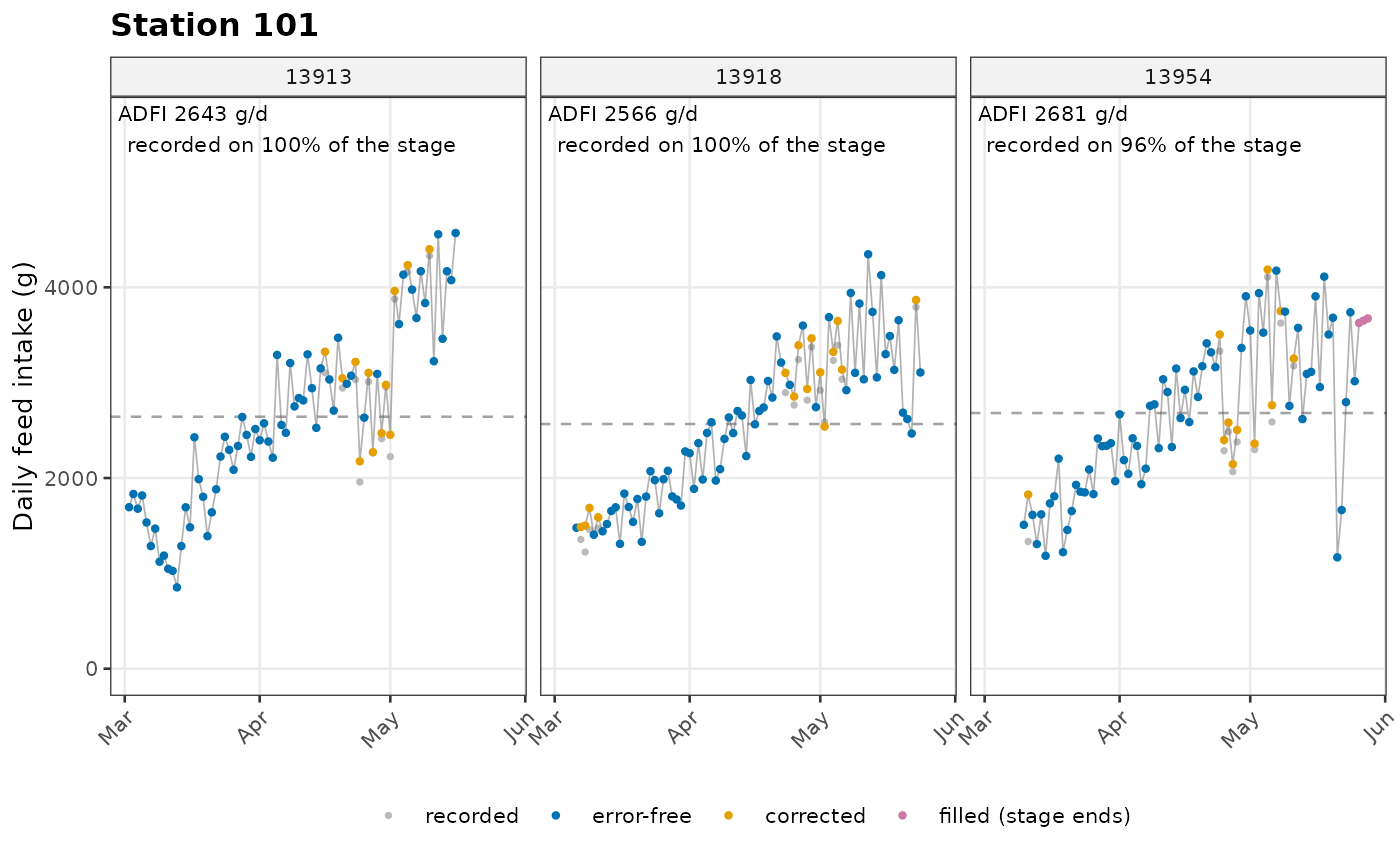
out <- save_plots(g, path = tempdir(), prefix = "loc", suffix = "growth", device = "pdf")
#> ✔ Saved 1 of 1 plot to /tmp/RtmpUJqsUI
file.exists(out$file)
#> [1] TRUE
unlink(out$file)
run_pipeline
run_pipeline() runs every step with one set of QC
settings and keeps all intermediate results.
res <- run_pipeline(fire, qc = qc_config(stage_range = c(60, 120)), verbose = 0)
res
#> ╭  Results FIRE  ───────────────────────────────────────────────────────────╮
#> │ Pigs   26 in the data · 25 with FCR (21 ok, 4 low confidence) · 1 removed │
#> │ ADG    1207 ± 106 g/d                                                     │
#> │ ADFI   3249 ± 250 g/d                                                     │
#> │ FCR    2.70 ± 0.16                                                        │
#> │                                                                           │
#> │ Check                                                                     │
#> │   25822 (101): weight records cover 5.1 kg of 70-80 kg                    │
#> │   35858 (102): weight records cover 4.4 kg of 100-110 kg                  │
#> │   35892 (102): weight data flagged                                        │
#> │   35897 (102): weight data flagged                                        │
#> │   35888 (101): removed, test period 9 d < 35 d                            │
#> │                                                                           │
#> │ Next: plot_adg(), plot_adfi(), write_report(), write_results()            │
#> ╰───────────────────────────────────────────────────────────────────────────╯
res$fcr$summary[group == "all"]
#>     group        trait     n          min          max       median
#>    <char>       <char> <int>        <num>        <num>        <num>
#> 1:    all          adg    25  939.7806629 1455.9297415 1205.5702281
#> 2:    all         adfi    25 2591.1968792 3875.9180223 3220.8402264
#> 3:    all          fcr    25    2.3545315    3.0172000    2.6729084
#> 4:    all           gf    25    0.3314331    0.4247129    0.3741243
#> 5:    all   stage_days    25   40.4287257   63.3513721   48.9403502
#> 6:    all start_weight    25   59.9999805   60.0000044   59.9999959
#> 7:    all   end_weight    25  119.9999801  120.0000042  119.9999944
#>            mean           sd           cv
#>           <num>        <num>        <num>
#> 1: 1207.2469699 1.058301e+02 8.766236e-02
#> 2: 3249.3079139 2.503801e+02 7.705644e-02
#> 3:    2.6982479 1.577920e-01 5.847943e-02
#> 4:    0.3718191 2.159314e-02 5.807431e-02
#> 5:   49.6475333 4.745273e+00 9.557922e-02
#> 6:   59.9999954 5.704224e-06 9.507041e-08
#> 7:  119.9999944 4.646078e-06 3.871732e-08
write_report
write_report() writes the results as a small website to
browse like a book: one page per station with its growth and feed intake
plots and a table of its pigs, and an overview page in front. Arrow keys
turn the pages; a pig ID in the search box jumps to its station.
res <- run_pipeline(nedap, verbose = 0)
dir <- file.path(tempdir(), "report")
write_report(res, dir)
#>
#> ── Writing the HTML report ─────────────────────────────────────────────────────
#> Saving plots ■■■■■■■■■■■■■■■ 1/4 | ETA  4s
#> Saving plots ■■■■■■■■■■■■■■■ 3/4 | ETA  1s
#> Saving plots ■■■■■■■■■■■■■■■ 4/4 | ETA  0s
#> ✔ Saved 4 of 4 plots to /tmp/RtmpUJqsUI/report/img
#> ✔ Report of 2 stations written to /tmp/RtmpUJqsUI/report/index.html 4.9s
# then open file.path(dir, "index.html") in a web browser
write_results
write_results() writes the tables of an analysis to CSV
files named <farm>_<table>_<date>.csv,
ready to send to the testing station. Files are UTF-8 with a byte order
mark so that Excel shows Chinese text correctly.
res <- run_pipeline(nedap, verbose = 0)
out <- write_results(res, dir = file.path(tempdir(), "results"), farm = "demo")
#> ✔ Wrote 9 files to /tmp/RtmpUJqsUI/results
out
#>           table                                                   file  rows
#>          <char>                                                 <char> <int>
#> 1:          fcr          /tmp/RtmpUJqsUI/results/demo_fcr_20261030.csv    29
#> 2:       by_bin       /tmp/RtmpUJqsUI/results/demo_by_bin_20261030.csv   258
#> 3:   daily_feed   /tmp/RtmpUJqsUI/results/demo_daily_feed_20261030.csv  2820
#> 4: daily_weight /tmp/RtmpUJqsUI/results/demo_daily_weight_20261030.csv  2607
#> 5:  weight_pigs  /tmp/RtmpUJqsUI/results/demo_weight_pigs_20261030.csv    30
#> 6:   feed_model   /tmp/RtmpUJqsUI/results/demo_feed_model_20261030.csv    14
#> 7:      summary      /tmp/RtmpUJqsUI/results/demo_summary_20261030.csv    14
#> 8:      removed      /tmp/RtmpUJqsUI/results/demo_removed_20261030.csv     1
#> 9:     settings     /tmp/RtmpUJqsUI/results/demo_settings_20261030.csv    43
unlink(file.path(tempdir(), "results"), recursive = TRUE)
validate_outliers, validate_adg and validate_adfi
Four functions check how well the methods of one step work on your own data, by hiding or spoiling part of the data on purpose and measuring how close the result comes to what is known:
-
validate_outliers()adds artificial errors to clean weight records and measures how many each outlier method finds, how many good records it removes, and how much ADG is affected. The clean records are those that no compared method flags (reference = "consensus"), so that no method is favoured; -
validate_adg()compares growth curve models (and, withextrap, the extrapolation) by blocked k-fold cross-validation (blocks ofblock_daysdays), and by how much ADG changes when the first or last days of the test are hidden (late entry, early exit); -
validate_weight_fill()hides recorded daily weights of the stage (random days, blocks, start or end), fills them again with each weight fill method and compares the filled weights and ADG with the recorded ones; -
validate_adfi()hides recorded feed intake days in the same way, imputes them again with each method ("loess_pop"with leave-one-out population curves,"loess_lm","linear") and compares ADFI with the recorded value. Withweight, the body weight of the hidden days is computed again without them.
In all of them, the weight records of the hidden days are removed before cleaning, and the rest is cleaned again, so the hidden days do not decide which of the other records are kept (since 1.5.0).
visits <- prep_visits(nedap, verbose = 0)
w <- clean_weight(visits, verbose = 0)

# 1. weight outlier methods: 5% artificial errors of 3-15 kg
vo <- validate_outliers(visits, reps = 1)
#>
#> ── Validating weight outlier methods ───────────────────────────────────────────
#> ℹ 7 methods · 5% artificial errors of 3-15 kg (both) · 1 repetition · reference: consensus
#> ⠙ [1/3] Clean records ■■■■■■■■■■■■■■■ 0/8 | ETA ?
#> ⠹ [1/3] Clean records ■■■■■■■■■■■■■■■ 1/8 | ETA  5s
#> ⠸ [1/3] Clean records ■■■■■■■■■■■■■■■ 2/8 | ETA  4s
#> ⠼ [1/3] Clean records ■■■■■■■■■■■■■■■ 3/8 | ETA  3s
#> ⠴ [1/3] Clean records ■■■■■■■■■■■■■■■ 4/8 | ETA  2s
#> ⠦ [1/3] Clean records ■■■■■■■■■■■■■■■ 5/8 | ETA  2s
#> ⠧ [1/3] Clean records ■■■■■■■■■■■■■■■ 6/8 | ETA  1s
#> ⠇ [1/3] Clean records ■■■■■■■■■■■■■■■ 7/8 | ETA  1s
#> ⠇ [1/3] Clean records ■■■■■■■■■■■■■■■ 8/8 | ETA  0s
#> ✔ [1/3] Clean records (8 cleanings) 4.2s
#> → [2/3] Reference ADG of the clean records ...
#> ✔ [2/3] Reference ADG of the clean records 0.7s
#> [3/3] Spoiled data, each method ■■■■■■■■■■■■■■■ 2/8 | ETA  6s
#> [3/3] Spoiled data, each method ■■■■■■■■■■■■■■■ 4/8 | ETA  4s
#> [3/3] Spoiled data, each method ■■■■■■■■■■■■■■■ 8/8 | ETA  0s
#> ✔ [3/3] Spoiled data, each method (8 runs) 6.4s
#> ✔ Done in 11.3s · details in $summary
#> 25,579 clean records of 29 pigs, 5% spoiled
#>                    errors found  good removed  ADG bias g/d  ADG RMSE g/d
#>   none                    1.1%         0.00%          -0.1           1.0
#>   track+rlm+loess        94.3%         0.54%           0.6           2.1
#>   track                  67.9%         0.04%           0.1           1.0
#>   rlm                    90.0%         0.20%           0.3           1.5
#>   loess                  91.0%         0.00%           0.0*          0.7
#>   rlm+loess              92.7%         0.20%           0.3           1.5
#>   stl                    95.3%*        0.29%           0.1           0.7*
#>   sd                     59.8%         0.00%*         -0.2           1.1
vo$summary
#>             method sensitivity false_positive_rate precision    adg_bias
#>             <char>       <num>               <num>     <num>       <num>
#> 1:            none  0.01147666        0.000000e+00 1.0000000 -0.11659561
#> 2: track+rlm+loess  0.94338179        5.355966e-03 0.9046222  0.60896392
#> 3:           track  0.67865340        3.707976e-04 0.9899554  0.08810530
#> 4:             rlm  0.89977047        1.977587e-03 0.9607843  0.34852591
#> 5:           loess  0.91048202        4.119974e-05 0.9991604  0.01913494
#> 6:       rlm+loess  0.92654935        1.977587e-03 0.9618745  0.32561561
#> 7:             stl  0.95256312        2.883982e-03 0.9467681  0.14346024
#> 8:              sd  0.59831676        0.000000e+00 1.0000000 -0.24175573
#>     adg_rmse adg_spearman n_pigs
#>        <num>        <num>  <num>
#> 1: 1.0261373    0.9995074     29
#> 2: 2.1436768    0.9990148     29
#> 3: 0.9870266    0.9995074     29
#> 4: 1.5429075    0.9990148     29
#> 5: 0.7442768    0.9995074     29
#> 6: 1.5014817    0.9990148     29
#> 7: 0.7311463    0.9990148     29
#> 8: 1.1217394    0.9990148     29

# 2. growth curve models
va <- validate_adg(w, models = c("poly1", "poly2", "poly3"))
#>
#> ── Validating growth curves ────────────────────────────────────────────────────
#> ℹ 29 pigs · 3 models · 5-fold CV in 7-day blocks · truncation 10, 20 days
#> ⠙ [1/3] Re-cleaning CV folds ■■■■■■■■■■■■■■■ 0/5 | ETA ?
#> ⠹ [1/3] Re-cleaning CV folds ■■■■■■■■■■■■■■■ 1/5 | ETA  2s
#> ⠸ [1/3] Re-cleaning CV folds ■■■■■■■■■■■■■■■ 2/5 | ETA  2s
#> ⠼ [1/3] Re-cleaning CV folds ■■■■■■■■■■■■■■■ 3/5 | ETA  1s
#> ⠴ [1/3] Re-cleaning CV folds ■■■■■■■■■■■■■■■ 4/5 | ETA  1s
#> ⠴ [1/3] Re-cleaning CV folds ■■■■■■■■■■■■■■■ 5/5 | ETA  0s
#> ✔ [1/3] Re-cleaning CV folds (5 folds) 2.8s
#> ⠙ [2/3] Re-cleaning truncations ■■■■■■■■■■■■■■■ 0/4 | ETA ?
#> ⠹ [2/3] Re-cleaning truncations ■■■■■■■■■■■■■■■ 1/4 | ETA  2s
#> ⠸ [2/3] Re-cleaning truncations ■■■■■■■■■■■■■■■ 2/4 | ETA  1s
#> ⠼ [2/3] Re-cleaning truncations ■■■■■■■■■■■■■■■ 3/4 | ETA  1s
#> ⠼ [2/3] Re-cleaning truncations ■■■■■■■■■■■■■■■ 4/4 | ETA  0s
#> ✔ [2/3] Re-cleaning truncations (4 truncations) 2.4s
#> [3/3] Fitting the curves ■■■■■■■■■■■■■■■ 6/29 | ETA  4s
#> [3/3] Fitting the curves ■■■■■■■■■■■■■■■ 18/29 | ETA  2s
#> [3/3] Fitting the curves ■■■■■■■■■■■■■■■ 29/29 | ETA  0s
#> ✔ [3/3] Fitting the curves (29 pigs x 3 models) 5.5s
#> ✔ Done in 10.9s · details in $summary
#> Cross-validation error (median over pigs, kg) and ADG error after truncation
#> (RMSE, g/d)
#>                CV kg  CV > 10 kg  late10  early10  late20  early20
#>   poly1+start  1.76        0.0%    23.6*    21.5*   29.0     51.9
#>   poly2+start  1.75        0.0%    31.3     23.0    28.2*    49.9*
#>   poly3+start  1.61*       0.0%    37.2     23.9    36.2     60.1
va$summary
#> Key: <model>
#>          model  cv_rmse   cv_mae cv_share_over bias_late10 rmse_late10
#>         <char>    <num>    <num>         <num>       <num>       <num>
#> 1: poly1+start 1.757314 1.414229             0    11.42217    23.62835
#> 2: poly2+start 1.752470 1.400581             0    24.01446    31.34774
#> 3: poly3+start 1.608416 1.264054             0    26.10989    37.18375
#>    spearman_late10 n_late10 bias_early10 rmse_early10 spearman_early10
#>              <num>    <int>        <num>        <num>            <num>
#> 1:       0.9600985       29     4.304331     21.47237        0.9965517
#> 2:       0.9694581       29     7.430822     22.99317        0.9960591
#> 3:       0.9586207       29     4.828772     23.93255        0.9960591
#>    n_early10 bias_late20 rmse_late20 spearman_late20 n_late20 bias_early20
#>        <int>       <num>       <num>           <num>    <int>        <num>
#> 1:        29   -5.101753    29.02241       0.9389163       29    0.2360863
#> 2:        29    9.869637    28.23587       0.9467980       29   14.0993443
#> 3:        29   16.996585    36.22437       0.9147783       29   -3.1912060
#>    rmse_early20 spearman_early20 n_early20
#>           <num>            <num>     <int>
#> 1:     51.85206        0.9714286        29
#> 2:     49.89048        0.9758621        29
#> 3:     60.12357        0.9325123        29

# 3. weight fill methods
vw <- validate_weight_fill(w, methods = c("linear", "poly2"),
                           scenarios = c("blocks3", "late20"), reps = 1)
#>
#> ── Validating weight fill methods ──────────────────────────────────────────────
#> ℹ 29 pigs · 2 methods · 2 scenarios · 1 repetition
#> ✔ [1/4] Reference ADG and hidden days (29 pigs) 0.3s
#> ⠙ [2/4] Re-cleaning masks ■■■■■■■■■■■■■■■ 0/2 | ETA ?
#> ⠹ [2/4] Re-cleaning masks ■■■■■■■■■■■■■■■ 1/2 | ETA  1s
#> ⠹ [2/4] Re-cleaning masks ■■■■■■■■■■■■■■■ 2/2 | ETA  0s
#> ✔ [2/4] Re-cleaning masks (2 masks) 1.3s
#> ✔ [3/4] Filling the hidden days (29 pigs x 2 masks x 2 methods) 1.2s
#> ✔ Done in 2.8s · details in $summary
#> Daily weight error on the hidden days (RMSE, kg)
#>                 blocks3  late20
#>   linear+start    0.93*   2.43*
#>   poly2+start     1.42    2.70
#> ADG error (RMSE, g/d)
#>                 blocks3  late20
#>   linear+start     5.1*   50.4*
#>   poly2+start      9.9    51.7
vw$summary
#>    scenario       method daily_rmse daily_mae  daily_bias    adg_bias  adg_rmse
#>      <char>       <char>      <num>     <num>       <num>       <num>     <num>
#> 1:  blocks3 linear+start  0.9280818 0.6722406  0.01704015  -0.7973775  5.118390
#> 2:  blocks3  poly2+start  1.4165707 1.1360263 -0.03049167  -5.8986291  9.871986
#> 3:   late20 linear+start  2.4261210 1.6707774  0.35260669  -6.7740568 50.394127
#> 4:   late20  poly2+start  2.7036040 2.1173202  0.75794465 -10.8701574 51.672192
#>    adg_spearman n_pigs
#>           <num>  <int>
#> 1:    0.9970443     29
#> 2:    0.9931034     29
#> 3:    0.9216749     29
#> 4:    0.9128079     29

# 4. feed intake imputation
adfi <- calc_adfi(visits, calc_adg(w, verbose = 0), verbose = 0)
vf <- validate_adfi(adfi, w, scenarios = c("random30", "late20"), reps = 2)
#>
#> ── Validating feed intake imputation ───────────────────────────────────────────
#> ℹ 29 pigs with coverage >= 0.8 · 3 methods · 2 scenarios · 2 repetitions · body weight without the hidden days
#> → [1/3] Leave-one-out population curves ...
#> ✔ [1/3] Leave-one-out population curves 0.0s
#> ⠙ [2/3] Body weight per mask ■■■■■■■■■■■■■■■ 0/4 | ETA ?
#> ⠹ [2/3] Body weight per mask ■■■■■■■■■■■■■■■ 1/4 | ETA  2s
#> ⠸ [2/3] Body weight per mask ■■■■■■■■■■■■■■■ 2/4 | ETA  2s
#> ⠼ [2/3] Body weight per mask ■■■■■■■■■■■■■■■ 3/4 | ETA  1s
#> ⠼ [2/3] Body weight per mask ■■■■■■■■■■■■■■■ 4/4 | ETA  0s
#> ✔ [2/3] Body weight per mask (4 masks) 3.5s
#> ✔ [3/3] Imputing the hidden days (29 pigs x 4 masks x 3 methods) 2.0s
#> ✔ Done in 5.6s · details in $summary
#> ADFI error (mean absolute error, % of the recorded ADFI)
#>              random30  late20
#>   loess_pop     1.05    1.34*
#>   loess_lm      1.05*   4.49
#>   linear        1.06    4.49
#> Rank correlation of ADFI with the recorded ADFI
#>              random30  late20
#>   loess_pop    0.990   0.980*
#>   loess_lm     0.990*  0.954
#>   linear       0.983   0.954
vf$summary
#>    scenario    method mean_abs_error_pct p95_abs_error_pct    bias_pct
#>      <char>    <char>              <num>             <num>       <num>
#> 1: random30 loess_pop           1.054756          2.747063  0.08312500
#> 2: random30  loess_lm           1.049116          2.652649  0.09695811
#> 3: random30    linear           1.059801          3.446624  0.12860912
#> 4:   late20 loess_pop           1.336754          3.504007 -0.29738898
#> 5:   late20  loess_lm           4.485321          7.063380  4.26201154
#> 6:   late20    linear           4.485321          7.063380  4.26201154
#>     spearman daily_rmse n_pigs
#>        <num>      <num>  <int>
#> 1: 0.9896552   454.9470     29
#> 2: 0.9899015   454.8497     29
#> 3: 0.9834975   491.0849     29
#> 4: 0.9802956   321.3658     29
#> 5: 0.9536946   678.6888     29
#> 6: 0.9536946   678.6888     29