library(tidypptsdm)
mon <- run_monitor(tidypptsda::fire, days = 7, verbose = 0)所有日表都有一个共同点:窗口内每个单位每天都有一行,没有访问的日子也在,计数为
0、其他列为
NA。停机的测定站、不吃料的猪因此不会从表中”消失”。
列名的后缀就是单位:_kg 千克、_h
小时、_min 分钟、pct_ 百分比、n_
计数。
测定站:stations
head(mon$stations)
#>    location       date n_pigs n_visits n_unidentified pct_unidentified
#>      <char>     <Date>  <int>    <int>          <int>            <num>
#> 1:      101 2024-02-16     12       90              0              0.0
#> 2:      101 2024-02-17     12       78              0              0.0
#> 3:      101 2024-02-18     12       54              0              0.0
#> 4:      101 2024-02-19     12       49              0              0.0
#> 5:      101 2024-02-20     12       61              1              1.6
#> 6:      101 2024-02-21     12       54              0              0.0
#>    occupation_h feed_kg feed_per_pig_kg weight_kg pct_weight_outlier
#>           <num>   <num>           <num>     <num>              <num>
#> 1:        15.01  41.358           3.446    112.90                9.4
#> 2:        15.53  42.995           3.583    114.62                5.2
#> 3:        13.56  48.809           4.067    114.97                3.8
#> 4:        11.99  45.895           3.825    117.08                2.1
#> 5:        13.42  49.421           4.118    118.91                1.7
#> 6: 12.57 45.630 3.803 119.58 3.7| 列 | 含义 |
|---|---|
location、date
|
测定站、日期 |
n_pigs |
当天有识别访问的猪数 |
n_visits |
全部访问次数(含未识别) |
n_unidentified、pct_unidentified
|
未读到耳标的访问次数及其百分比 |
occupation_h |
测定站被占用的总时间,小时 |
feed_kg |
全部访问的采食量,kg |
feed_per_pig_kg |
识别访问的采食量 ÷ n_pigs
|
weight_kg |
每头猪当天体重中位数(去掉异常值)的平均 |
pct_weight_outlier |
体重异常值的百分比:同一头猪同一天的体重,超出四分位数 ±
iqr_k × 四分位距(Tukey fences)的记录;少于 4
次称重时不判异常 |
列出的测定站是窗口内或窗口前 14 天内有访问的测定站:停止记录的测定站会显示两周(并报警),早已撤出测定的则不再列出。
栋:houses
栋由测定站编号的前 house_width 个字符决定,例如
house_width = 1 时测定站 203 属于栋
2。
head(mon$houses)
#>     house       date n_stations n_pigs n_visits feed_kg feed_per_pig_kg
#>    <char>     <Date>      <int>  <int>    <int>   <num>           <num>
#> 1:      1 2024-02-16          2     25      136  92.257           3.690
#> 2:      1 2024-02-17          2     25      120  94.368           3.775
#> 3:      1 2024-02-18          2     25       99 105.488           4.220
#> 4:      1 2024-02-19          2     25       85  97.304           3.892
#> 5:      1 2024-02-20          2     25      107 111.142           4.446
#> 6:      1 2024-02-21          2     25      100 102.731           4.109
#>    weight_kg
#>        <num>
#> 1:    119.13
#> 2:    120.74
#> 3:    121.71
#> 4:    123.54
#> 5:    125.06
#> 6:    126.45
n_stations 是该栋的测定站数,其余列与
stations 相同。
猪:pigs 和 pig_summary
pigs
每头猪每天一行,从这头猪第一次出现(或窗口开始)到窗口最后一天:
head(mon$pigs)
#>    location responder       date n_visits feed_kg occupation_min weight_kg
#>      <char>    <char>     <Date>    <int>   <num>          <num>     <num>
#> 1:      101     25822 2024-02-16        5   2.850           56.6     116.8
#> 2:      101     25822 2024-02-17        6   2.914           57.2     117.8
#> 3:      101     25822 2024-02-18        4   3.980           60.5     118.5
#> 4:      101     25822 2024-02-19        4   3.227           46.7     120.9
#> 5:      101     25822 2024-02-20        6   2.056           36.2     121.9
#> 6:      101     25822 2024-02-21        5   3.091           48.5     118.6
#>    status
#>    <char>
#> 1:     ok
#> 2:     ok
#> 3:     ok
#> 4:     ok
#> 5:     ok
#> 6: ok| 列 | 含义 |
|---|---|
location |
窗口内这头猪访问最多的测定站 |
n_visits、feed_kg、occupation_min
|
当天的访问次数、采食量、占用时间(分钟) |
weight_kg |
当天体重的中位数 |
status |
no_visit(无访问)、low_feed(采食量 <
low_feed_kg)或 ok
|
pig_summary 每头猪一行:
head(mon$pig_summary)
#>    location responder  days no_visit_days low_feed_days mean_feed_kg
#>      <char>    <char> <int>         <int>         <int>        <num>
#> 1:      101     25822     7             0             0        2.703
#> 2:      101     35853     7             0             0        4.028
#> 3:      101     35855     7             0             0        4.736
#> 4:      101     35862     7             0             0        3.610
#> 5:      101     35865     7             0             0        3.500
#> 6:      101     35869     7             0             0        3.397
#>    last_feed_kg last_visits last_weight_kg days_since_visit status
#>           <num>       <int>          <num>            <int> <char>
#> 1:        0.801           5          119.1                0     ok
#> 2:        2.618           5          131.4                0     ok
#> 3:        2.188           2          139.3                0     ok
#> 4:        1.304           1          124.2                0     ok
#> 5:        1.707           3          125.1                0     ok
#> 6: 2.710 5 99.6 0 ok| 列 | 含义 |
|---|---|
days |
窗口内的天数(从第一次出现算起) |
no_visit_days、low_feed_days
|
无访问、低采食的天数 |
mean_feed_kg |
平均日采食量,无访问的日子按 0 计 |
last_feed_kg、last_visits
|
最后一天的采食量、访问次数 |
last_weight_kg |
最近一次的日体重中位数 |
days_since_visit |
距上次访问的天数 |
status |
最后一天的状态 |
每小时:hours
最后一天(或 monitor_hours(date = )
指定的一天)每台测定站 0–23
时每小时一行:n_pigs、n_visits、occupation_min、feed_kg。小时按进站时间计。
警报:alerts
mon$alerts
#>      level         type location responder  value
#>     <char>       <char>   <char>    <char>  <num>
#> 1: warning    feed_drop      101      <NA> 24.660
#> 2: warning    feed_drop      102      <NA> 19.167
#> 3: warning pig_low_feed      102     35857 -0.012
#> 4: warning pig_low_feed      102     35860  0.006
#> 5: warning pig_low_feed      102     35861  0.096
#> 6: warning pig_low_feed      102     35882  0.300
#> 7: warning pig_low_feed      102     35883  0.004
#>                                                                  message
#>                                                                   <char>
#> 1: Feed intake 24.7 kg, 46% below the mean of the earlier days (45.7 kg)
#> 2: Feed intake 19.2 kg, 65% below the mean of the earlier days (54.9 kg)
#> 3:             Ate -0.01 kg (below 0.5 kg); 1 low-feed day in the window
#> 4:              Ate 0.01 kg (below 0.5 kg); 1 low-feed day in the window
#> 5:              Ate 0.10 kg (below 0.5 kg); 1 low-feed day in the window
#> 6:              Ate 0.30 kg (below 0.5 kg); 1 low-feed day in the window
#> 7: Ate 0.00 kg (below 0.5 kg); 1 low-feed day in the window| 列 | 含义 |
|---|---|
level |
danger 或 warning,danger 排在前面 |
type |
station_down、unidentified、feed_drop、pig_no_visit、pig_low_feed
|
location、responder
|
测定站;猪只警报还有耳标号 |
value |
触发的数值:未识别百分比、采食量 kg、无访问天数 |
message |
说明 |
阈值都是 run_monitor()
的参数:low_feed_kg、max_unidentified_pct、max_feed_drop_pct、iqr_k。
图
plot_monitor(type = ) |
内容 |
|---|---|
"trend" |
猪数、访问次数、未识别 %、占用时间、采食量、头均采食量和体重的逐日变化。体重线是各猪当天体重中位数的平均,灰色带是当天最轻到最重的猪;无访问的日子标红 |
"intake" |
堆叠柱状图,每头猪一种颜色:上图为每头猪占测定站当天总采食量的比例(%),下图为采食量(kg),柱顶标出当天总量(窗口不超过
31 天时)。最后一天没有访问或采食量偏低的猪,在图例中标
[no visit]、[low feed]
|
"weight" |
每天全部体重记录的箱线图,红点在须线以外 |
"hours" |
最后一天每小时的访问次数、占用时间、采食量 |
plot_monitor(mon, "intake", locations = "102")$plot[[1]]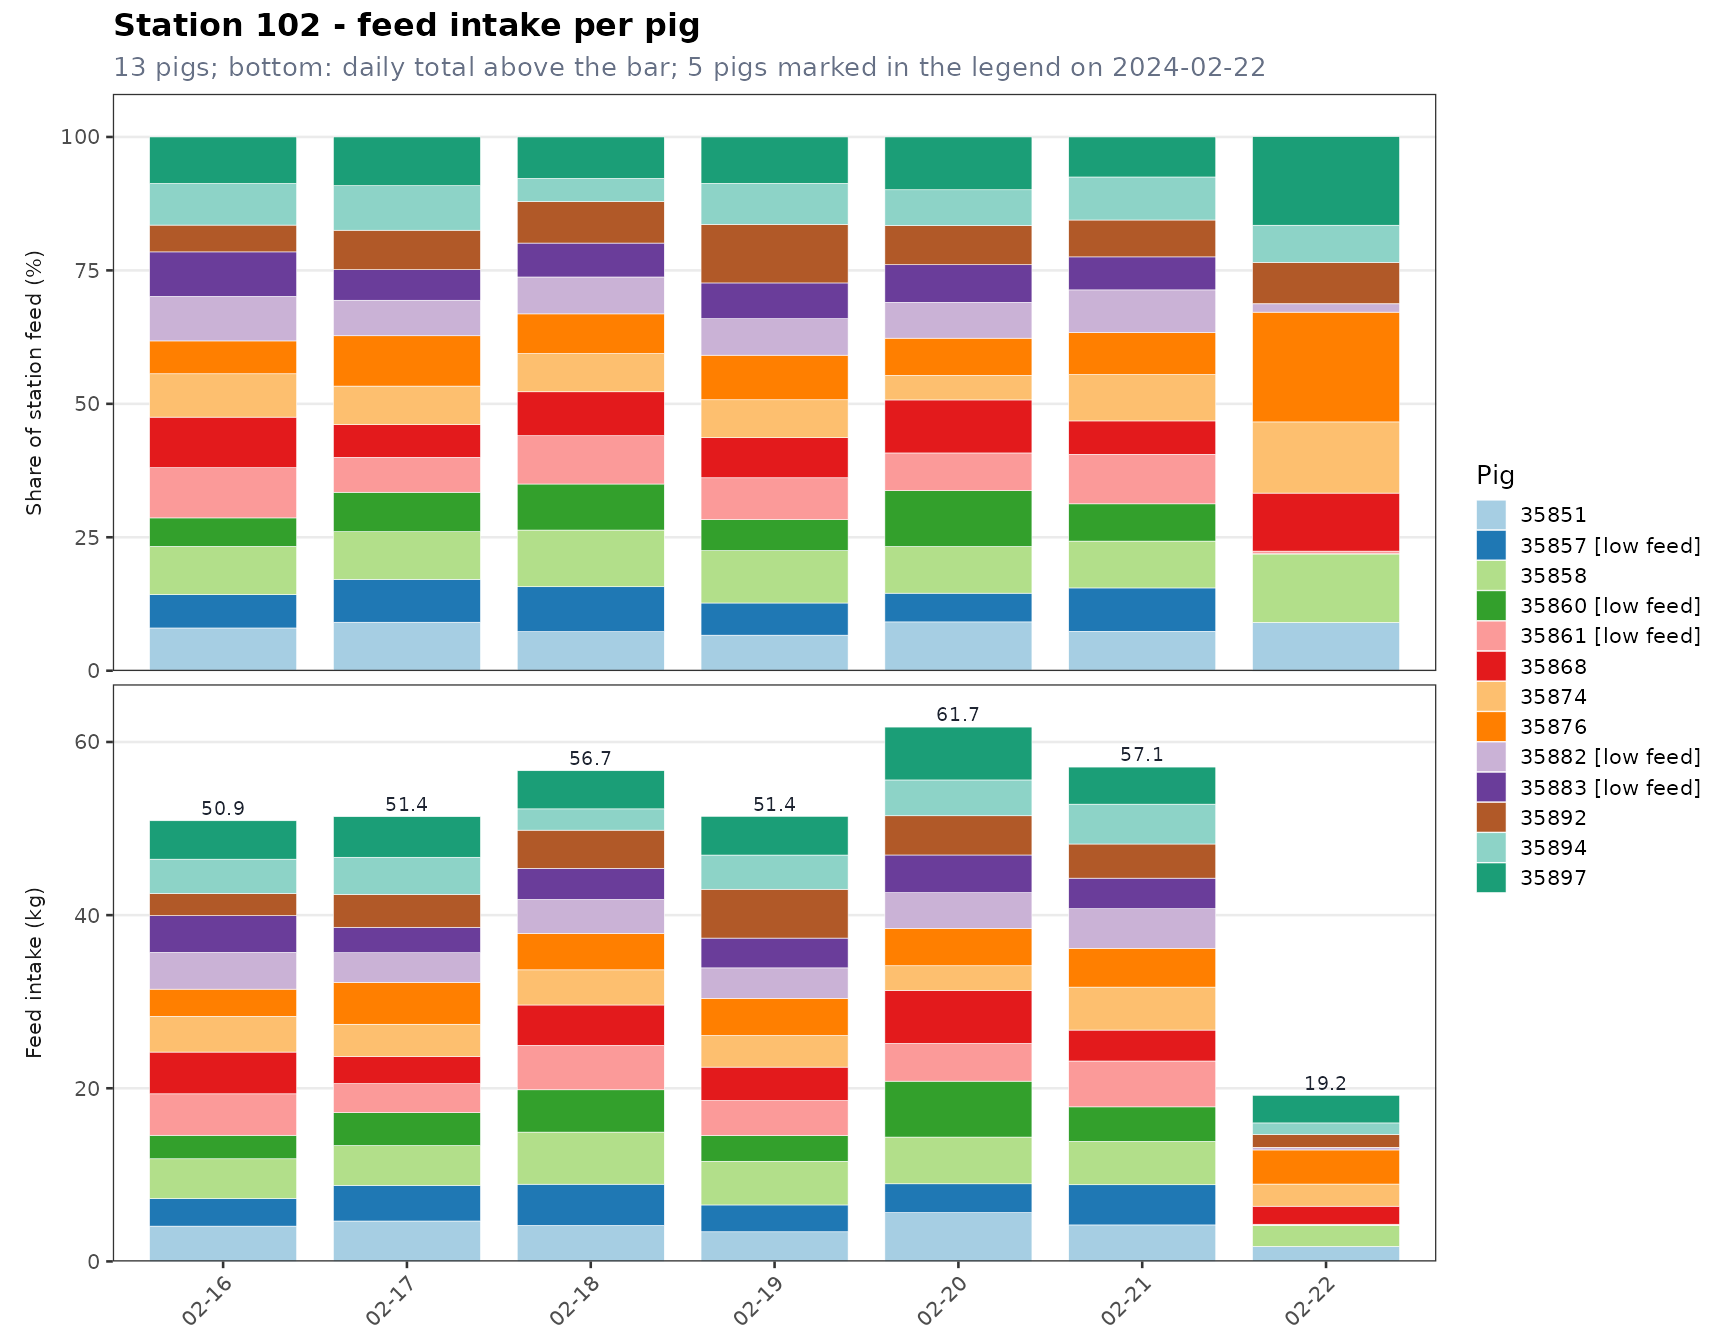
plot_monitor(mon, "trend", locations = "102")$plot[[1]]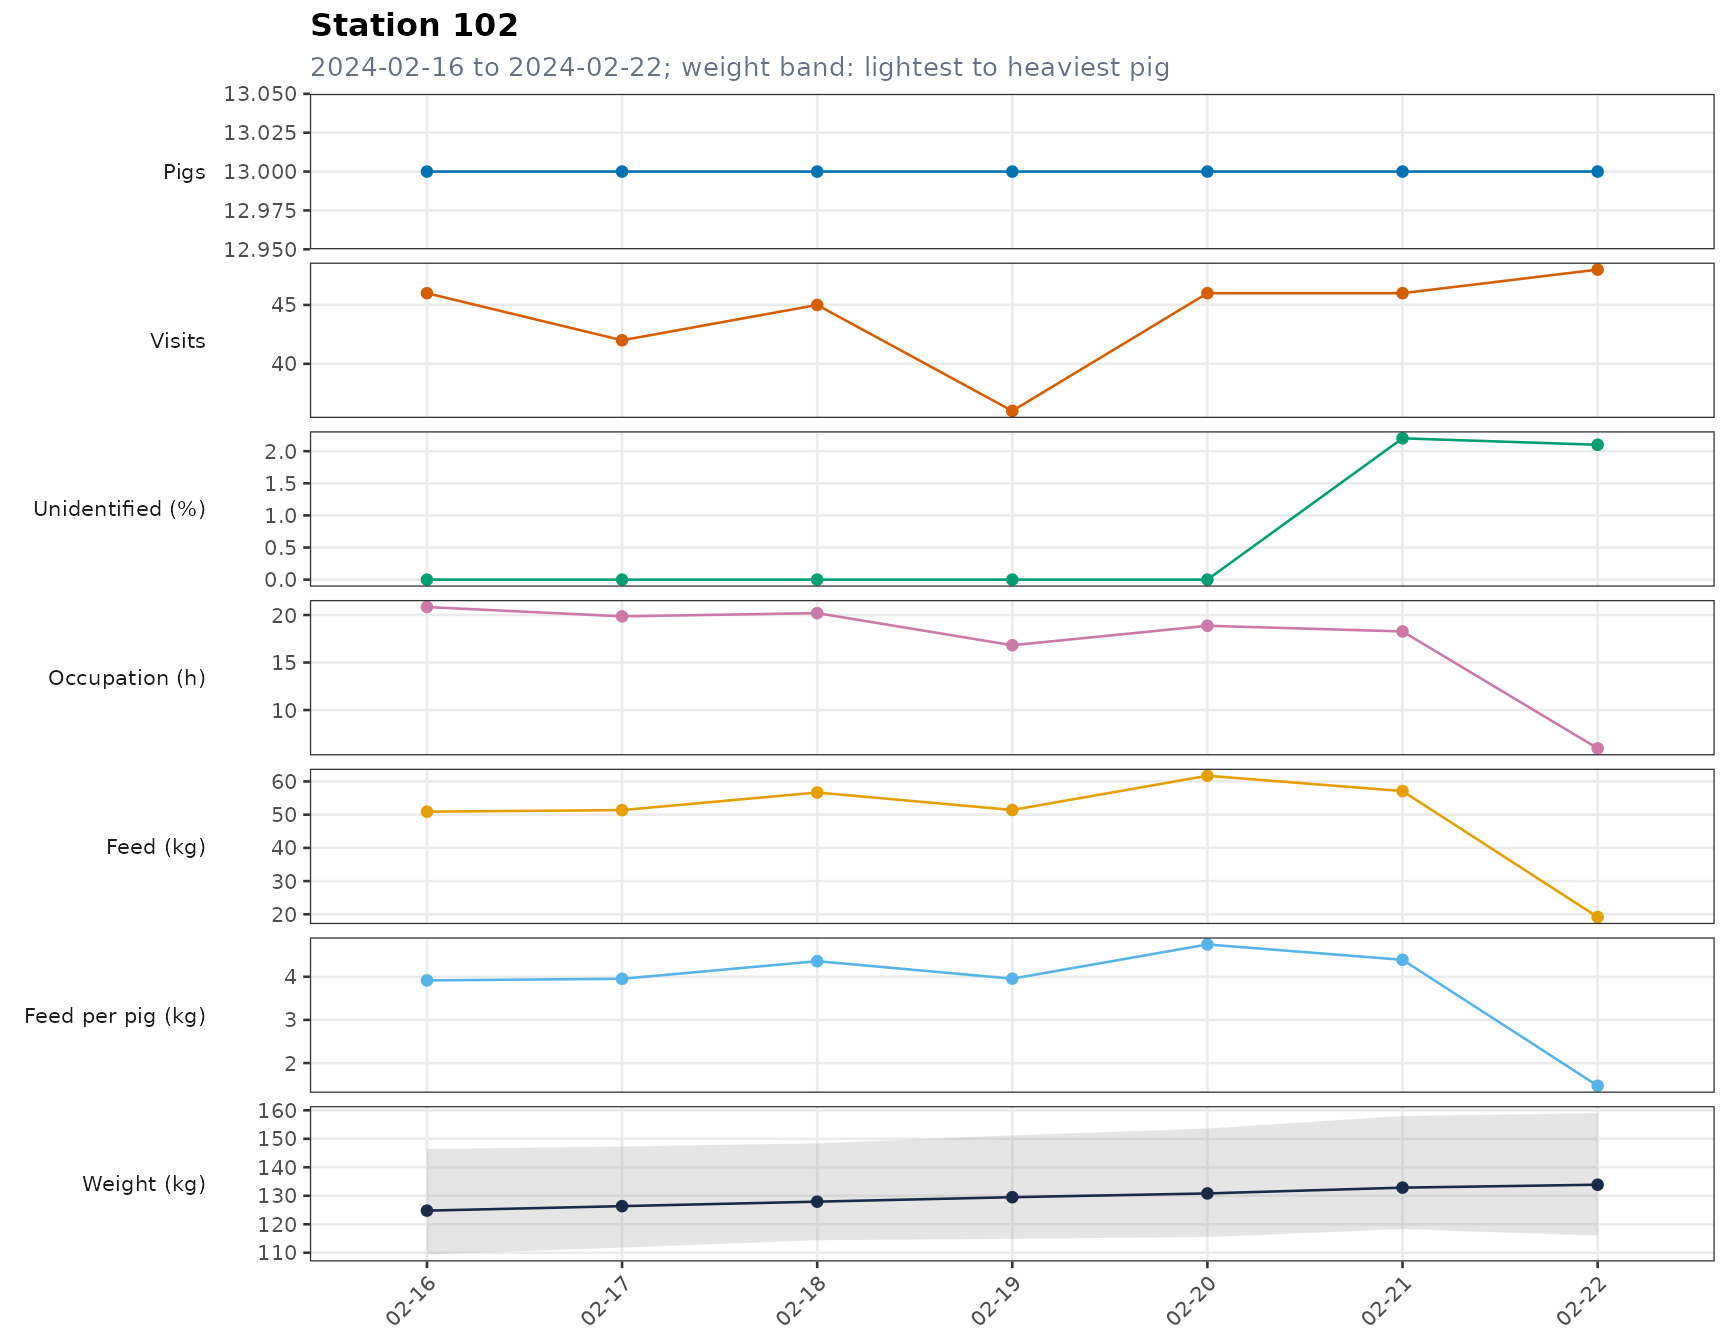
Excel 工作簿
write_monitor_tables(mon, path) 写出
monitor.xlsx(需要 openxlsx 包)。长表原样写出,宽表(见
wide_table())加三色色阶:红色表示可能有问题。
| 工作表 | 内容 | 红色表示 |
|---|---|---|
Alerts |
警报 | |
Stations、Houses、Pigs、Pig days
|
长表(Pigs 是
pig_summary,Pig days 是
pigs) |
|
Visits |
每站每天访问次数 | 偏低 |
Unidentified pct |
未识别访问 % | 偏高 |
Feed kg、Feed per pig kg
|
采食量、头均采食量 | 偏低 |
Occupation h |
占用时间 | 偏低 |
Weight outliers pct |
体重异常值 % | 偏高 |
House feed per pig kg |
每栋头均采食量 | 偏低 |
House weight kg |
每栋平均体重 | (蓝色色阶) |
Pig feed kg |
每头猪每天采食量 | 偏低 |
Hours visits、Hours feed kg
|
最后一天每小时 | (蓝色色阶) |
format = "csv" 则写出 6 个 CSV
文件(monitor_alerts.csv 等),带 BOM,Excel
直接打开不会乱码。